Selected work Franchise retail · Profitability analytics
Understanding profitability across a growing store network.
A rapidly expanding gourmet retail franchise needed to understand profitability across its national network and whether nearby openings were drawing sales from existing stores. I built a peer-comparison method and two Tableau tools for expansion decisions and individual-store support.
Consulting · Analytic Vizion
Explore the working dashboard- Role
- Data solution expert (consultant)
- Delivered
- 2 Tableau tools: executive and store-level
- Audiences
- Leadership · Franchise owners · Success coaches
The challenge
As the franchise expanded across the country, leadership needed a clear view of profitability and growth across a changing network. National averages could not explain whether a store was underperforming or operating in a different market or stage of maturity.
Expansion also raised a location question: were nearby openings drawing sales from existing stores? Executives needed a national view for growth discussions, while franchise owners and success coaches needed enough detail to investigate and support individual locations.
Which stores needed support, and how were new openings affecting nearby locations?
- Different store profiles weakened network-wide comparisons
- National trends could obscure individual-store performance
- New openings complicated the interpretation of existing-store sales
What I owned and built
My ownership I designed the peer-comparison methodology, analyzed potential sales cannibalization, and built the executive and store-level Tableau tools.
- 01Methodology
Define a fair comparison
I grouped each store with similar stores, so its profitability was judged against true peers instead of the whole network.
- 02Analysis
Investigate possible cannibalization
I used SQL and Snowflake to examine whether nearby store openings were drawing sales from existing locations, informing discussions about placement and expansion.
- 03Experience
Connect national oversight to store support
I built a centralized executive dashboard and a detailed Tableau tool, giving leadership a network view and regional managers, franchise owners, and success coaches a way to investigate individual stores.
Explore the store-comparison tool
Deidentified working demo
Select a store and explore how its gross profit compares with similar locations. This demo shows the peer-comparison tool from the engagement.
- Choose a store and metric using the selectors at the top.
- Adjust the peer filters, such as store age or market population.
- Compare the orange selected-store series with its peers, then explore the cost and margin detail below.
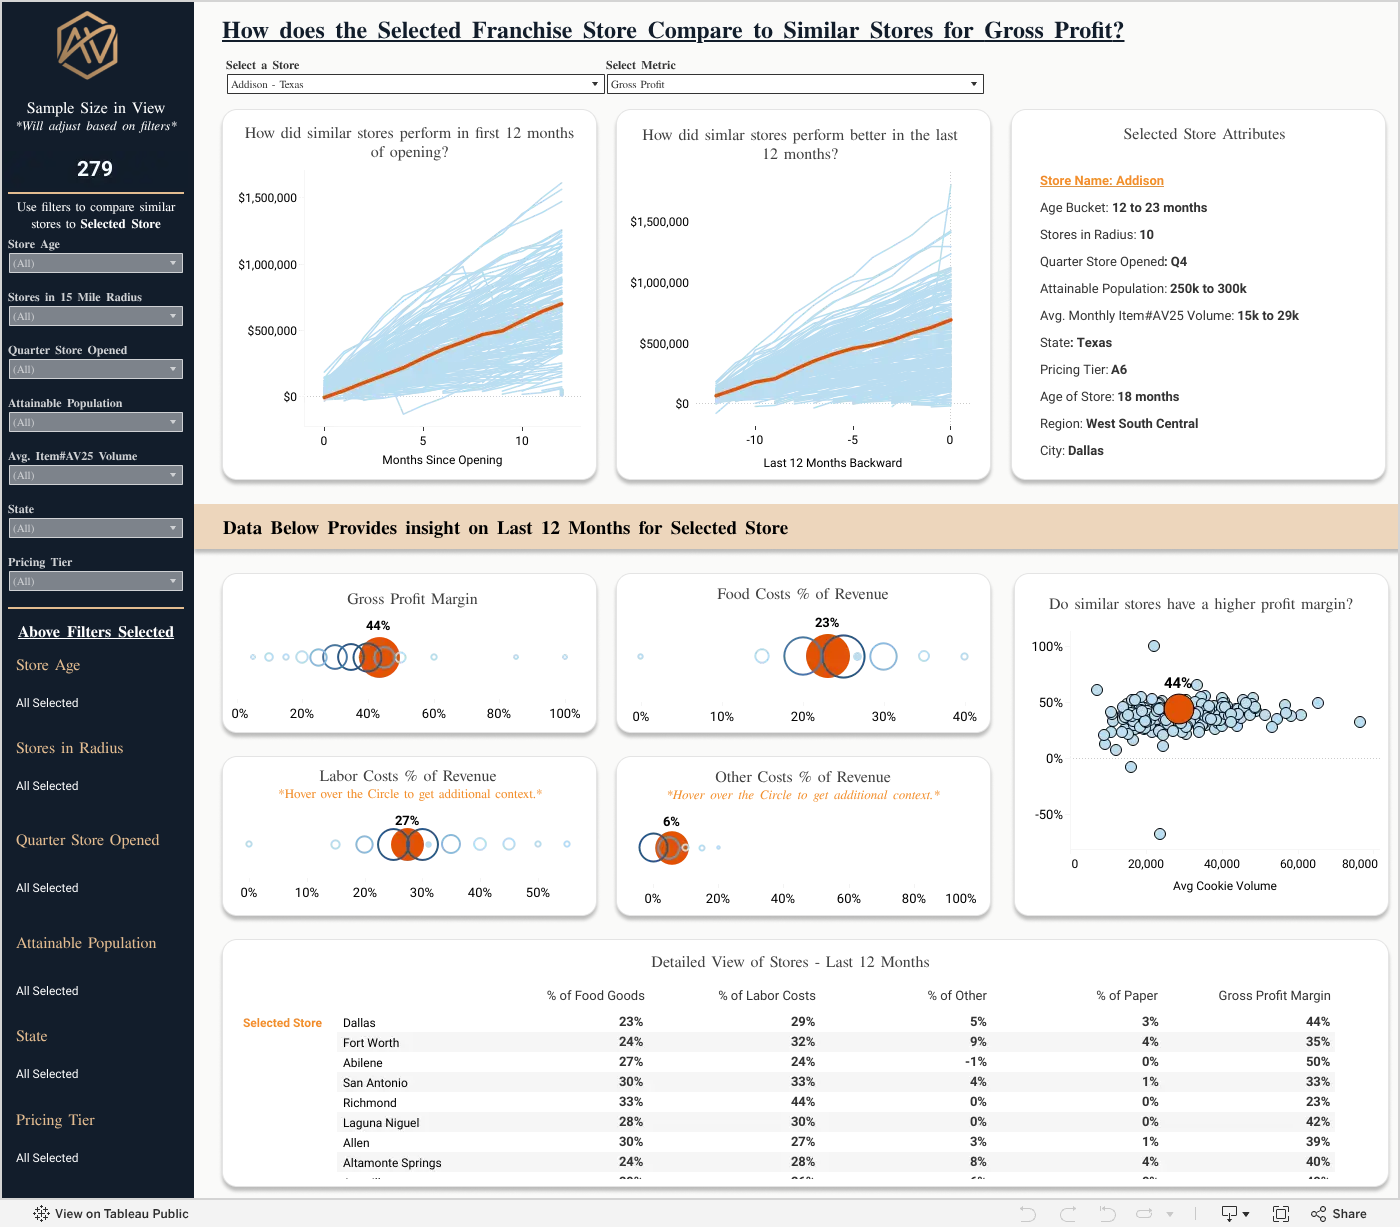
For the full comparison workspace, open the dashboard in Tableau Public. The inline version is available on larger screens.
Make the benchmark fit the store.
A network average blends new stores with mature ones and dense markets with sparse ones. I matched each store to a peer group on its profile and compared them over the same months since opening, so profitability is read against a fair benchmark.
- Store age
- Nearby stores
- Market population
- Pricing tier
- Region
Tools & methods
Data platform & engineering
- Snowflake
- SQL
Visualization & delivery
- Tableau Desktop
- Tableau Server
- Tableau Cloud
Methods & practices
- ETL pipelines
- Peer-group comparison
- Profitability analysis
- Cannibalization analysis
- Executive and operational dashboard design
Development lifecycle
- Sandbox
- Development
- Production
What changed
More focused store support
Franchise owners and success coaches could identify stores lagging comparable peers and use detailed views to investigate where support was needed.
Expansion decisions with context
Leadership could examine nearby-store sales alongside network growth when discussing store placement and expansion.
A shared national and local view
Centralized Tableau tools gave executives and store teams a consistent comparison, with different levels of detail for their decisions.
Key takeaways
Define what makes stores comparable.
Store profiles and maturity help determine whether a performance gap warrants closer investigation.
Read growth at both network and store level.
Review network growth alongside nearby-store performance to understand where new openings may be shifting demand.